
Getting and playing with the data is getting easier and more accessible for organizations. We have already taken the fact “the human mind is capable of doing almost anything” to a new level through some of the finest discoveries in recent times. So, specializing in predictive analysis, data mining, forecasting, web scraping, visualization etc., from the data which is already on the internet was never a big thing for us.
As per the companies, it enables them to drive innovation, and maybe that’s a way to make yourself future proof. It’s true that evolution always wins, and if the use of business intelligence tools is in the future, then why not be the early birds and reap the rewards as quickly as possible. Maybe the all-time question was finding a way to get this data in a more organized way, and now we could also do that.
Business Intelligence tools like Power BI are all over the place. With more and more people getting linked to the internet, enterprises are coming up with loads of data for practical use. Businesses from all around the globe are looking to gain insights from this actionable information by carrying out a thorough analysis using several business intelligence tools.
The integration of Python in Power BI was one of Microsoft’s best decisions in April 2019. The addition of python has made things easier for the users as they can employ these excellent libraries and utilize some of the machine learning packages to improve their data visualization skills. In this detailed article, we will try to tell more about Power BI, Python and how a blend of both could make things easier for you. Let us start with understanding the basics.
What is Power BI?
If you are a data analyst or a business intelligence professional, you need no introduction to this fantastic software. Since we are touching everything from the head, then why not learn it one more time. Power BI is a SaaS platform established by Microsoft Corporation. It’s good to see that these innovative big companies are expanding their reach to other genres to make things possible for other organizations.
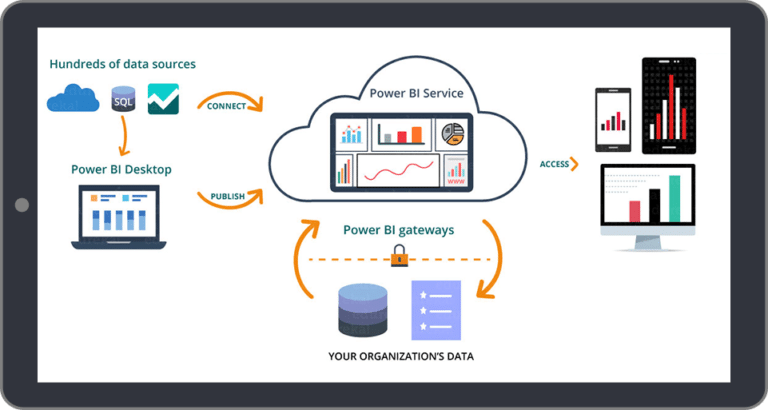
Power BI is a leading business intelligence tool that allows you to analyze your organizational data and collaborate with anyone in your organization, irrespective of your location. Every department in the organization can use Power BI to create interactive, real-time dashboards, reports, observe the latest campaign trends and customer conversion, and much more.
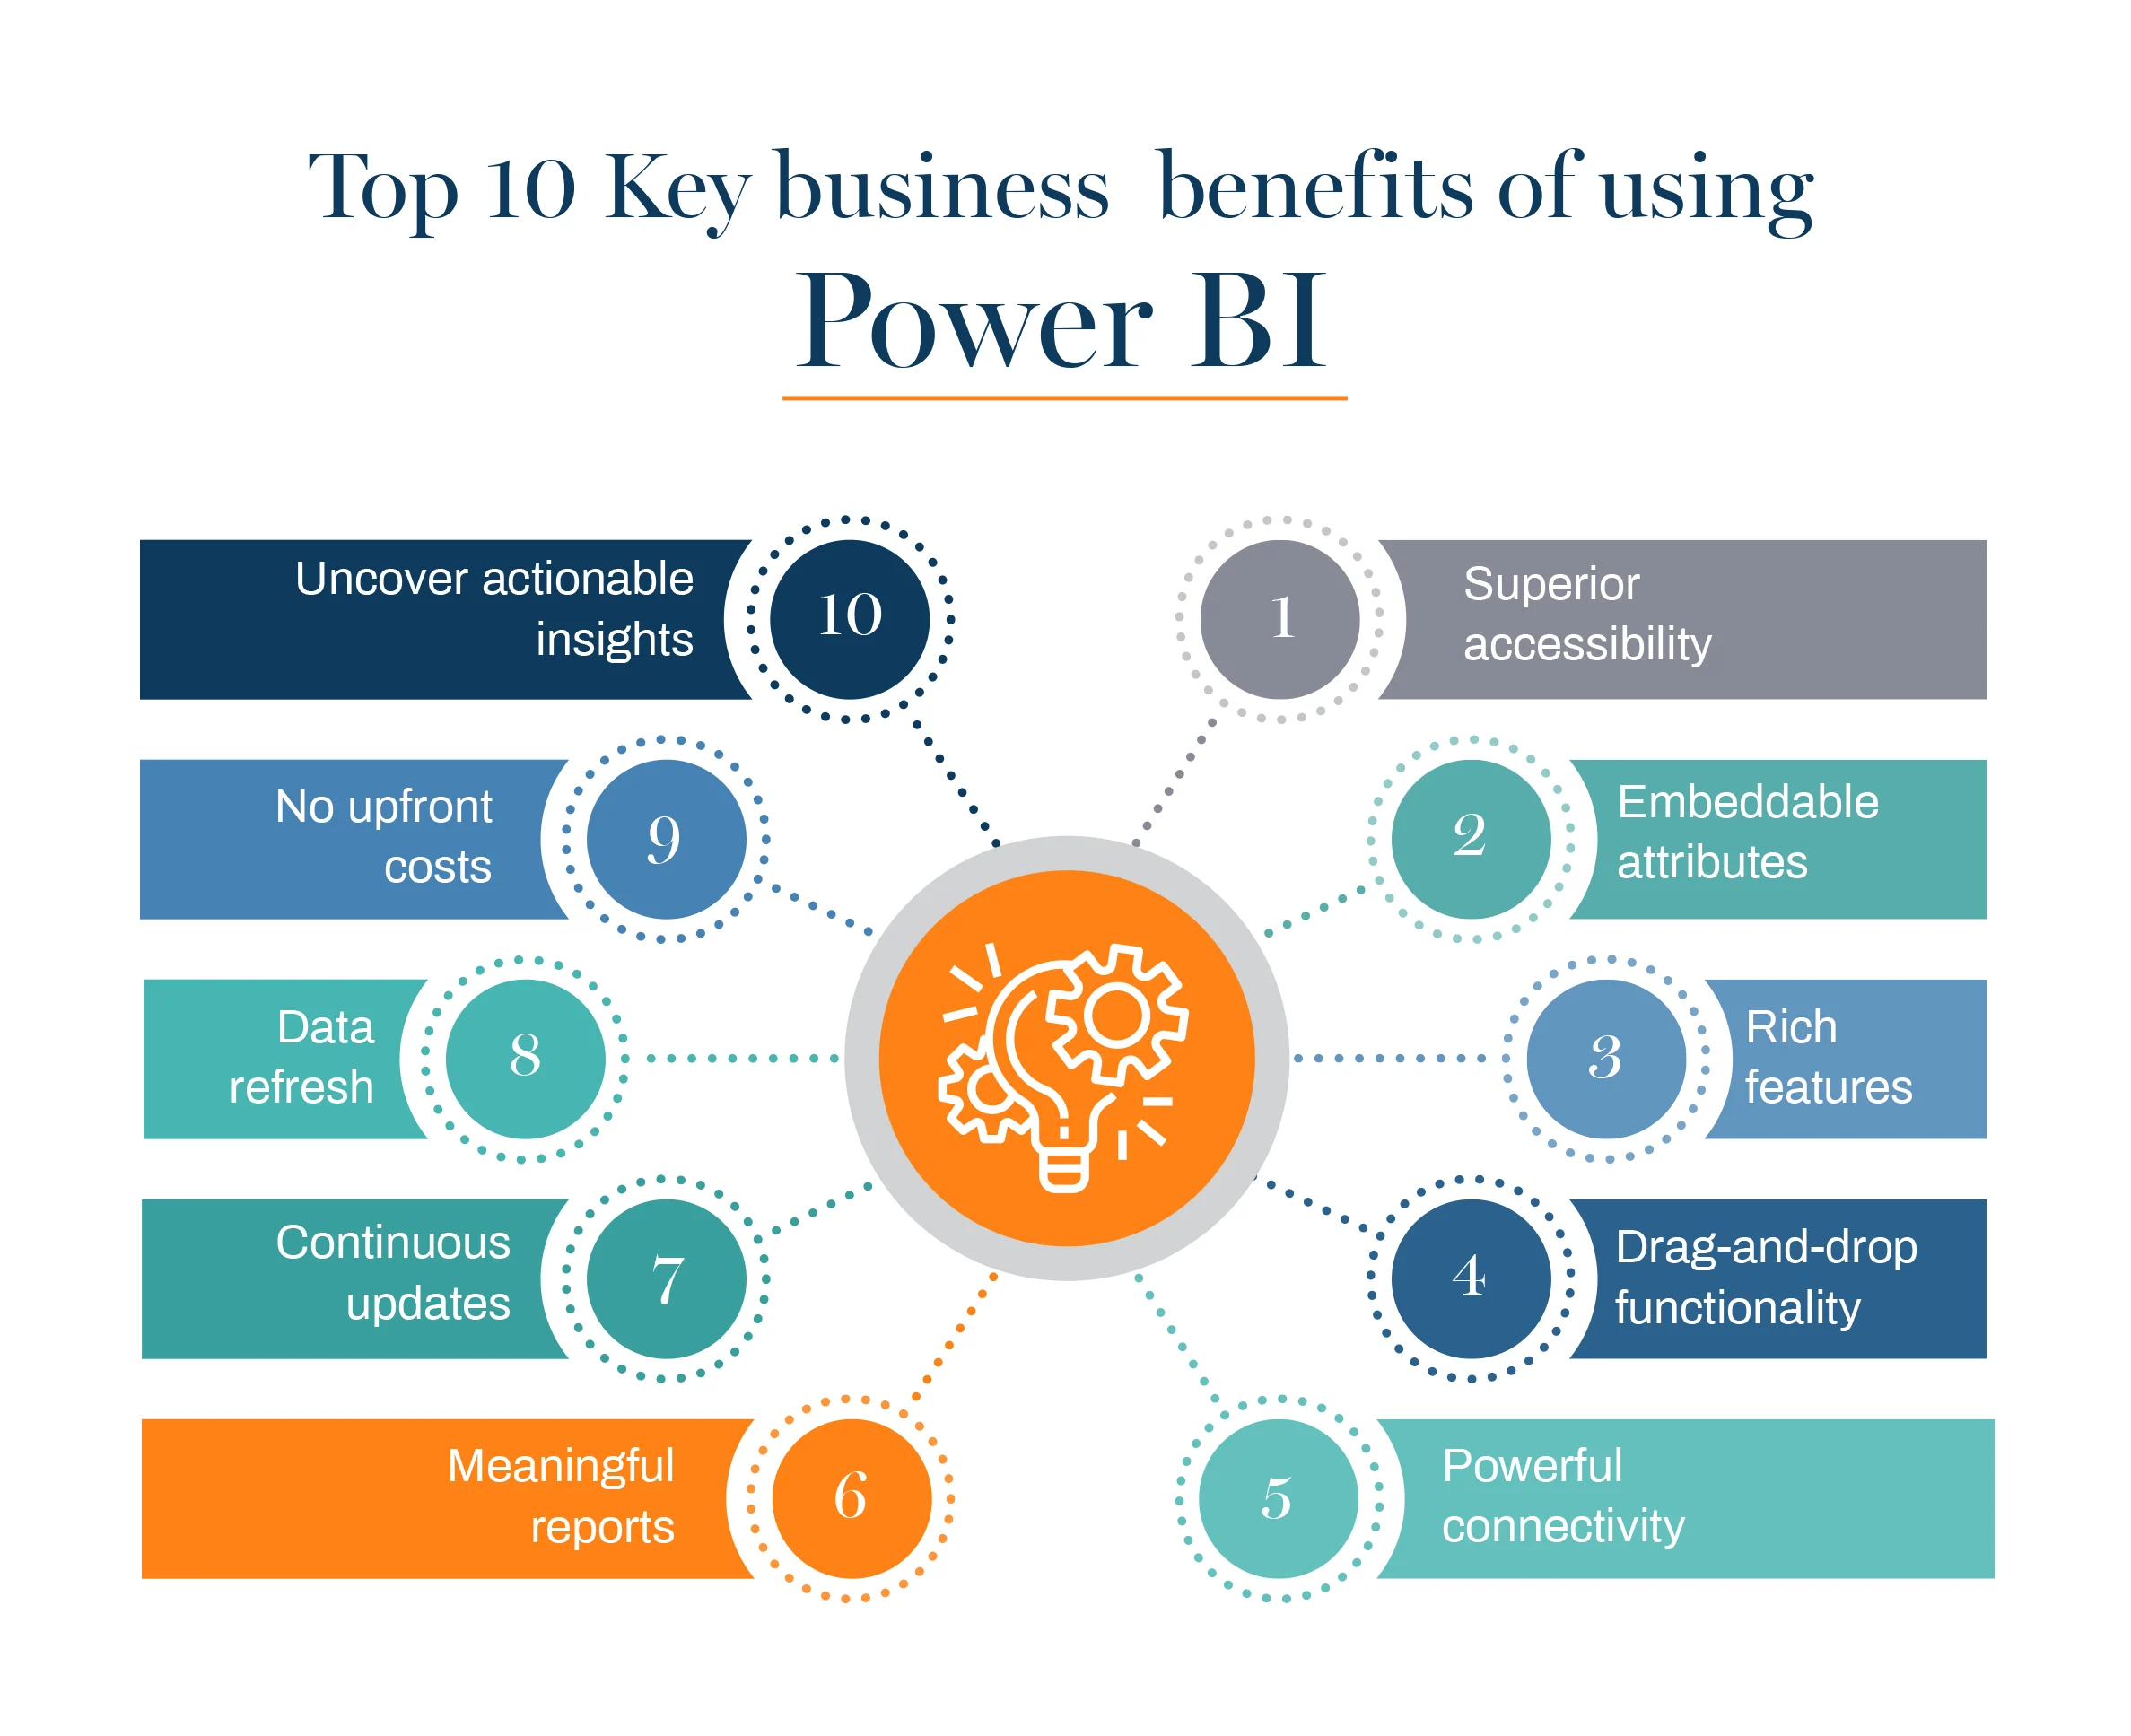
Some of the key features of Microsoft’s Power BI are:
- Create Innovative and Interactive Visualizations
- Easy analysis of data using functions
- Multiple Dataset Visualizations
- Navigation Pane
- Highly Customizable Dashboards
Understanding the Need of Integrating Python in Power BI
We all know that python is an interpreted, high-level and general-purpose programming language that has numerous applications in the market. First, to create visualizations that connect with Power BI, which is terrific at creating dashboards. Dashboards from Power BI will consist of visualizations developed using python to better understand the organization’s growth, metrics, KPI, etc. So building a power BI python integration means putting two top players of their time in the same team.
Other Benefits of Integrating Python in Power BI
- Allowing users to run Python Scripts directly from within Power BI
- Python is exceptional and with high use in the field of data analysis. Even most of the data science libraries and machine learning frameworks are written in python. Integration of Python in Power BI means quickly creating data analysis scripts within the Power BI.
- Use of data visualization libraries like Seaborn and Matplotlib in Power BI that only python supports.
- As more and more companies are leaning towards open source technologies, the addition of scripting in Python within Power BI to create data analysis scripts becomes a whole lot simpler.
- Extensive and super-rich libraries like Pandas and NumPy can also use Python in Power BI for precise calculations.
Prior Requirements to work with Python in Power BI
To make Python work in Power BI, we need to have the following prerequisites for a smooth and error-free process.
- Python runtime installed – This includes the installation of the execution runtime on which Python scripts can operate.
- Install the required libraries – Helpful libraries like Pandas and Seaborn that makes Power PI more robust.
- Visual studio code – Installing VS code is optional as you can also install any other code editor to write your Python scripts. You can also write your scripts in Power BI script editor. But with VS code, you will get other essential features.
- Updating Power BI settings – Finally, we need to update the settings in the Power BI so you can work with Python in Power BI. This step will allow you to write scripting with Python in Power BI. For this, you need to open the Power BI desktop and click on the file. Click on options and settings and then go to opportunities to open a new dialogue box in Power BI. Further, click on Python scripting and select the path from both home directories and the Python IDE. Click on OK once you are done.
Method to Set up Power BI Python Integration
Setting up Power BI Python Integration
Now that we have set up the prerequisites, we can begin writing Python scripts and using them in Power BI. In the second step, you will see a simple script that will work flawlessly before merging it into Power BI. A guide to set up your system with Power BI Python Integration progressively.
Step 1 – Allowing Python Scripting in Power BI
It would help if you started with installing the Power BI Desktop application. After the installation, click on the drop-down file menu, which you can find in the top right corner. Clicking on the setting, you will find the options button. Under options, you need to select Python Scripting. Clicking on it will take a few minutes to load the Python Script Page. At this point, you need to specify the home directory, which is the local Python installation path. Click on OK as this step is complete.
Step 2 – Scribbling Down the Python Script
Visit your local Python IDE and start with writing a Python Script. Before writing the script, make sure you import and use Pandas and Matplotlib libraries to create your own desired data model and visualizations. You can also create data frames using Pandas to ensure that this method works.
Running the below script in the local IDE will make sure you have no errors in the code.
import pandas as pd
data = [[‘Pam’,10],[‘Michael’,12],[‘Jim’,13]]
df = pd.DataFrame(data,columns=[‘Name’,’Age’],dtype=float)
print (df)
The output of this code will be:
Name Age
0 Pam 10.0
1 Michael 12.0
2 Jim 13.0
Let us move on to our next step.
Step 3 – Running the Python Script in Power BI
To run your Python Script in Power BI, you need to visit Home Ribbon and navigate the Get Data menu. This will open the window options from where you need to select the Get Data Window. Select from the Python Script Option you need to run on the loaded page and click on the connect button as shown on your screen. A new Python Script window with an empty dialog box will open. You do not have to write the code again, as you can copy the code written in your local Python Script and paste it into the dialog box. Click on the OK button to start the Python Script in Power BI.
Step 4 – Importing Data into Power BI
Once you run the script, the navigator window opens, and you can load the data and use it. The information on your screen means the data is now loaded into Power BI. You have successfully integrated python in the Power BI. You can start creating your visualizations with this data directly.
One of the drawbacks of Power BI is that it doesn’t allow you to create complex data frames. But python is a comprehensive language, enabling the development of complex data frames easily. With this merge now, you can import such complex data sets Power BI using python. This integration makes it easy to perform data manipulation using libraries like Pandas which can only be possible because of python. This will surely make using Power BI easier for professionals, especially Data Scientists and Data Analysts who already know how to manipulate data using python. Let us see an example of it.
Using Power Query to Transform Data
For the experts in python, transforming data is more or a less straightforward activity. But if a person is new to data science, then it can be quite tricky for them. However, with Power Query Editor, you can easily bend and transform the data with a few clicks. And the best part is Power BI also keeps the record of all the operations that go into the data transformation pipeline before any analysis. Let us see how:
If you have some data with you, then you can start by loading it in Power BI. Once loading is complete, click on Transform Data under the Home tab to open the Query Editor. Once Query Editor is launched, you can see many options to reshape, clean, and even transform the loaded data with just a few steps.
Creating Python Visuals in PowerBI Reports
Let us have a look at how the Python-Power BI integration can be used to get advanced visuals from python combined with the native data drill through and DAX functionalities.
We can get started with selecting the Python visuals icons from the visualizations panel in the Power BI desktop software. All the required fields can be added from the dataset so it can internally create a Pandas DataFrame. It will allow us to write custom scripts using libraries like Matplotlib and Seaborn to create some stunning visuals which were not possible before the integration of Python in Power BI. Moving ahead, you can use Power BI functionalities like filters, slicers on top of the python visuals to make selections as required.
Creating a Dynamic bar chart to visualize IMDb 2016 movie dataset
Let us have a look at this small tutorial on creating a custom visual in python and adding slicers to have an interactive visual experience of the data provided to it.
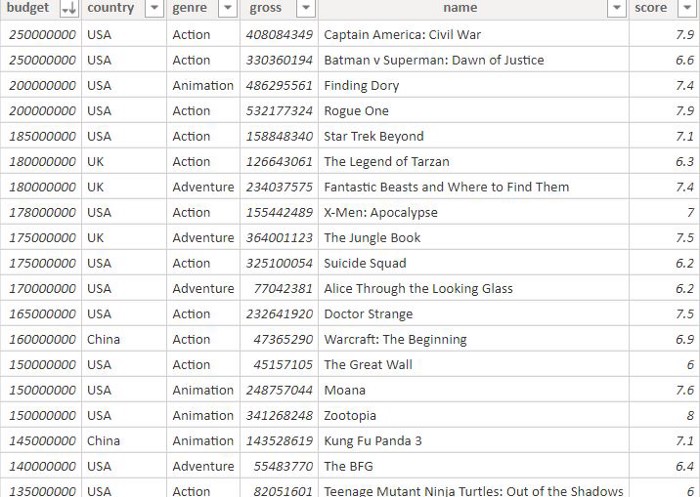
The data consist of a list of movies released in 2016, an IMDB score of 6 or more, and differentiators like Budget, Gross, Genre, and Scores. So, a custom radial bar chart is created by scripting Python in Power BI and using Matplotlib. We have used the slicers and filters from Power BI to create this fantastic dataset.

Slicers from Power BI usually select Genre, country, and score range for the data set like average score and gross collections can be set and displayed. This advancement allows us to explore the data in a better way and make inferences as required.
Conclusion
In this article, we learned about Power BI, the benefits of integrating Python with Power BI, and a comprehensive inclusion method of Python in Power BI. There are certainly loads of analysis out there that demonstrates how we use Python with Power BI, like analyzing the data to predict the behavior of a set of customers. We have also seen how to create Python Visuals in PowerBI Report and use power queries to transform data.
One thing is sure is this integrated environment will give more PowerPower into the hands of professionals that use PowerPower BI. You can easily extend its capabilities and enhance the way Power BI works. If you want to learn more about using Python in Power BI, we recommend studying Microsoft’s official documentation.
Or if you choose to be fed in easily with the right concepts, we would recommend you to talk to our representatives or the people who chalked this one out!
Let us know if this piece helped you in any possible way!